
Why Tron investors should be cautious despite the high burn rate


Tron’s social volume increased last week, but its development activity and price sank substantially, which was bearish.
Tron was down by more than 3% in the last 24 hours.
A few market indicators were bullish, while the others suggested otherwise.
Tron [TRX], being a deflationary asset, has always paid close attention to its burn rate, which most of the time has been impressive. However, the concern for investors still remained, as despite the token’s promising burn rate, its price did not get affected by that.
Tron’s burn rate is astonishing
Tron has been famous for its deflationary characteristics since its launch. Mentioning its current state, Tron Community’s latest tweet said that the blockchain burned over 12.7 million TRX on 22 July 2023. As per the tweet, it showcased a commitment to deflation and value growth with a net negative production ratio of -7,653,235.
Separately, the blockchain’s network stats also remained optimistic. For instance, its total accounts crossed 174 million, while its total transactions exceeded the 6 billion mark. Its transfer volume also remained green, suggesting high usage of the blockchain.
While network statistics remained promising, the blockchain’s key metrics dwindled. For example, its development activity declined. A drop in the metric means that fewer efforts were made by the developers to improve the blockchain. Apart from development activity, the token price also sank by more than 3% in the last 24 hours.
This was accompanied by a dip in its trading volume. At press time, Tron was trading at $0.08343, with a market capitalization of over $7.4 billion. Despite the drop in price and volume, it was interesting to see that the token’s social volume went up last week, reflecting its popularity.

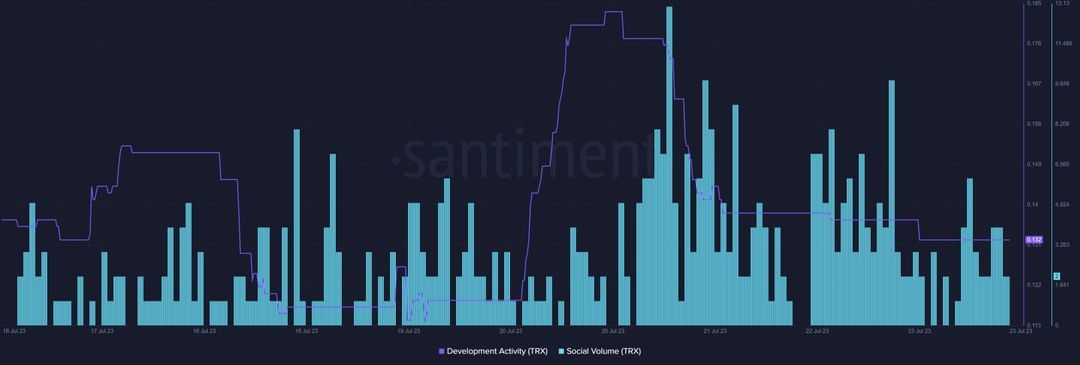
Source: Santiment
A closer look at Tron’s state
The good news was that Tron’s open interest declined while its price dropped, suggesting a trend reversal. However, its one-week price volatility increased. TRX’s funding rate also turned green after a drop, suggesting that it was in demand in the derivatives market.
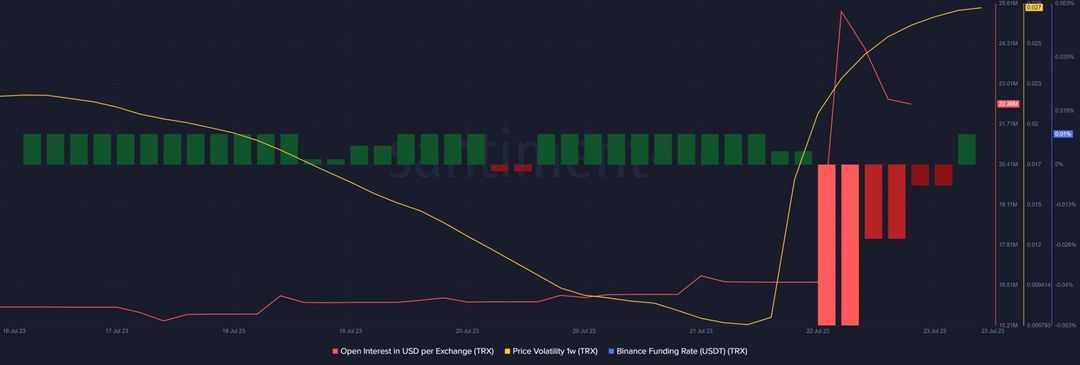
Source: Santiment
A look at the token’s daily chart painted an ambiguous picture. For instance, the Exponential Moving Average (EMA) Ribbon and MACD displayed a clear bullish advantage in the market.
On the other hand, Tron’s Relative Strength Index (RSI) and Chaikin Money Flow (CMF), both registered declines. The last two indicators increased the chances of a continued downtrend, which was against investors’ interests. The way TRX moves will be interesting to watch.

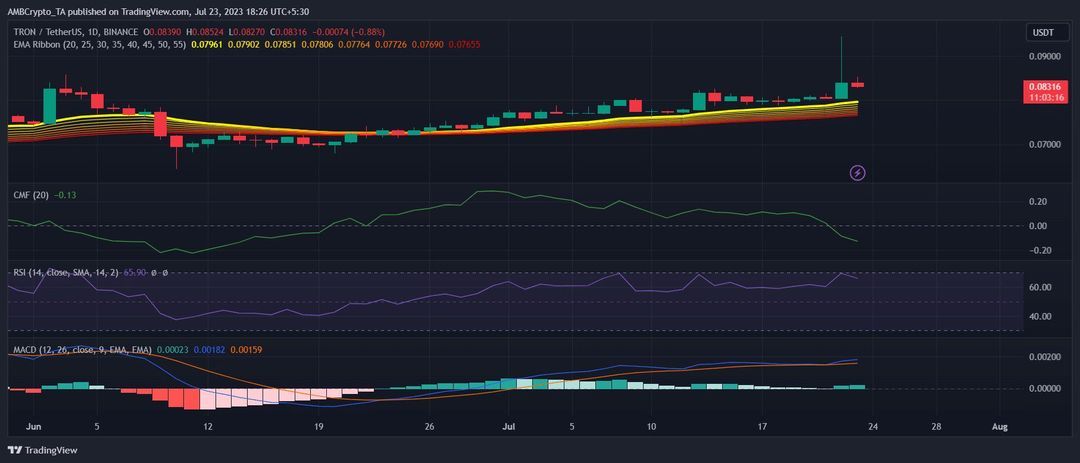
Source: TradingView
Disclaimer: The information presented does not constitute financial, investment, trading, or other types of advice and is solely the writer’s opinion.
10 comments