TRON (TRX) Price Analysis: Will the Bulls Continue to Push the Price Higher?

October 16 was a great day for TRON (TRX). While the price of Bitcoin (BTC) surged to $30,000 with news of an ETF that would later be denied, TRX reacted differently. The sentiment around TRX was positive, as there was an increase in dominance of stablecoins on the network.
Previous TRX price analysis revealed that $0.085 and $0.082 were two key support levels. Last week, the price dropped to $0.0847 before rising to $0.088. Can the bulls sustain this upward momentum?
TRON (TRX) Coin Analysis
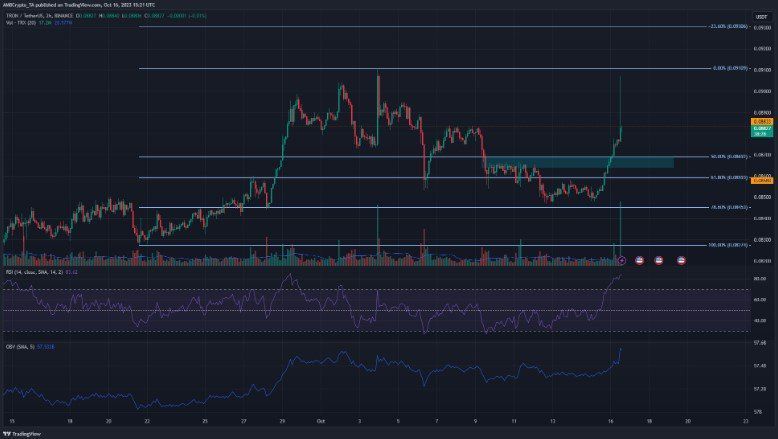
A closer look at the 2-hour price chart of TRX indicated a bearish structure. However, breaking above the $0.0858 resistance level on October 15 disrupted the previous downward trend. At the time of writing, the altcoin was trading near the $0.0882 resistance level.
The Relative Strength Index (RSI) showed an upward trend in the past 24 hours. The sharp rise above the neutral 50 level indicated this movement. On-Balance Volume (OBV) also indicated strong buying pressure, as it has been consistently rising in the past three days. These are positive signs for further price increases in TRX.
Short-term Fibonacci correction and extension levels (light blue) were plotted on the chart based on the upward movement in late September. According to the chart, the next resistance levels are located at $0.091 and $0.093 respectively.

TRON (TRX) Coin Future
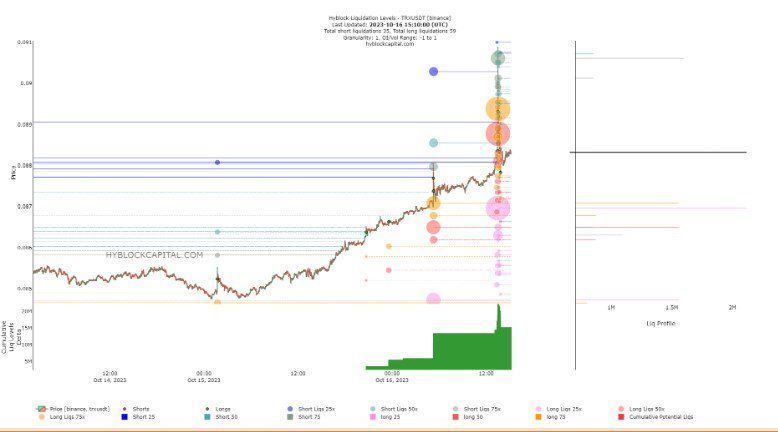
Liquidity levels provided by Hyblock indicated a significant amount of short positions evaporating due to the recent price movement, which reached as high as $0.09. A loss of $1.6 million occurred at $0.0906. Additionally, an increase in long positions in Open Interest (OI) may be causing concerns for investors, as they may be forced to close these long positions depending on the price movement.
On the downside, a larger potential liquidation of $2.7 million could occur at $0.0869. This price zone represents the 50% retracement level on the TRX price chart. As a result, in the coming days, there may be a price movement towards $0.0869 or $0.0859 in search of liquidity. Buyers may wait for test levels based on this information before opening long positions and consider trading afterwards.

1 comment