All you need to know about Litecoin’s latest milestone

Litecoin Foundation revealed that the blockchain’s hashrate has reached a new all-time high.
At the time of writing, LTC’s hashrate stood at 770.81 TH/s. LTC price registered a decline, and a few on-chain metrics were bearish.
The Litecoin [LTC] mining industry has been growing for quite some time now, registering new all-time highs. A possible reason for this could be the increment in LTC’s market cap as it lured miners looking for profits. However, the possibility of things turning sour for Litecoin can’t be ruled out considering the current market trend.
Litecoin mining is becoming popular
Litecoin Foundation revealed in a 27 June tweet that the blockchain’s hashrate reached a new all-time high of 957.22 TH/s. As per the tweet, this update was a direct illustration of the steady, healthy, and maturing growth of the LTC network and Litecoin’s network security.
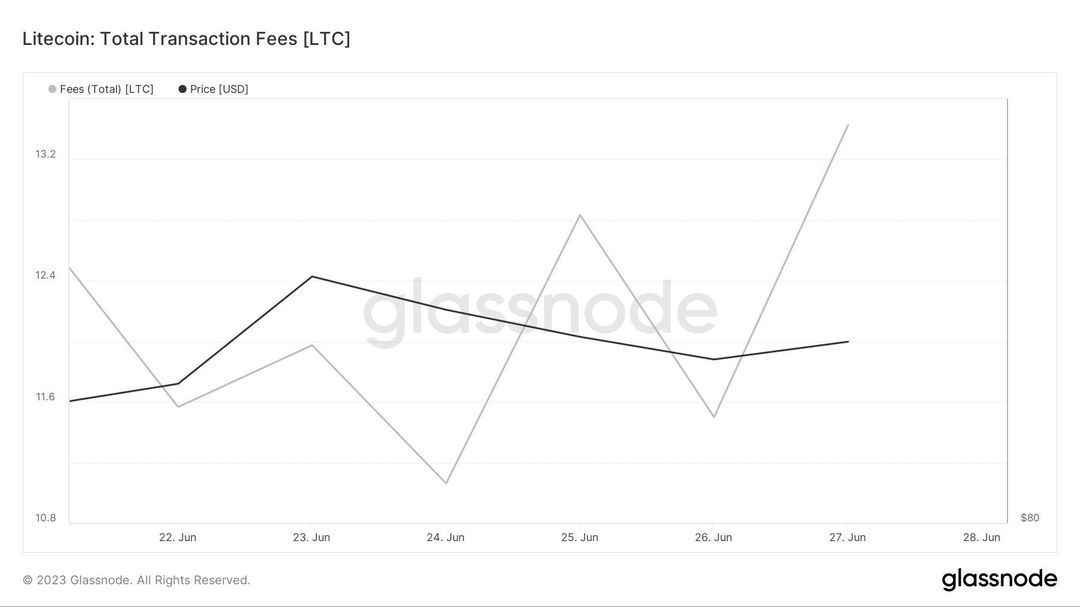
An increase in hashrate means that more miners are entering the LTC mining space. It was interesting to note that while the hashrate climbed, miner fees also registered an uptick.

Source: Glassnode
However, things have started to change as LTC’s hashrate declined in the last 24 hours. As per Coinwarz, at the time of writing, LTC’s hashrate stood at 770.81 TH/s.
LTC witnesses a price correction
After a comfortable week of over 6% gains, the scenario changed as LTC’s price dropped. According to CoinMarketCap, LTC’s price declined by more than 1% in the last 24 hours.
At press time, it was trading at $87.04 with a market cap of over $6.2 billion. A decline in price can have a negative impact on the mining industry, as miners might choose to exit as their profits reduce.
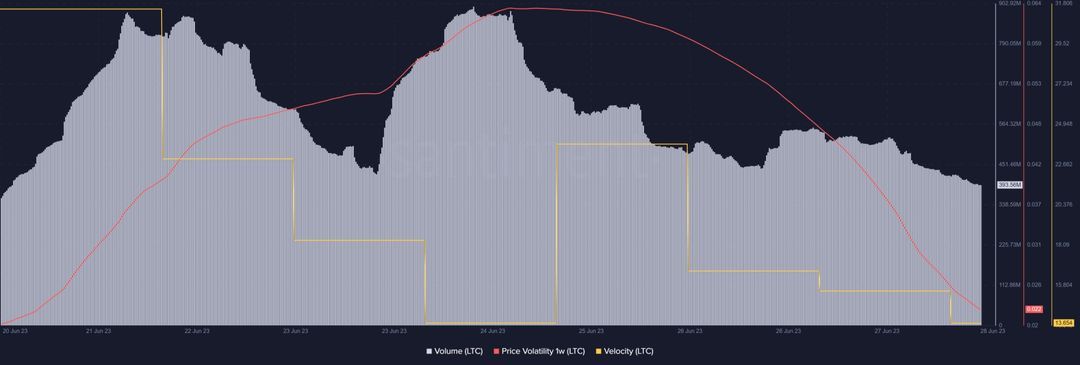
Litecoin’s one-week price volatility plummeted and this decreased the chances of a sudden uptrend. Its volume also declined, reflecting a lower willingness of investors to trade the coin. Another bearish signal was its declining velocity, which meant that LTC was used less often within a set time frame.

Source: Santiment
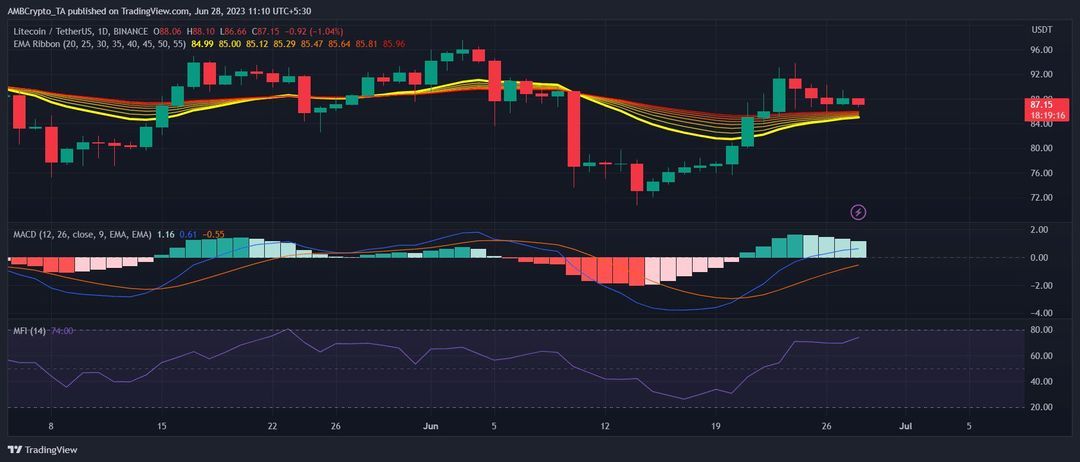
While the metrics were bearish, a few of the market indicators supported the bulls. For instance, the distance between the 20-day Exponential Moving Average (EMA) and the 55-day EMA was declining, increasing the chances of a bullish crossover.
Additionally, Litecoin’s MACD displayed a bullish upper hand in the market. Nonetheless, its Money Flow Index (MFI) was right near the overbought zone, which could raise selling pressure in the coming days.

Source: TradingView
Disclaimer: The information presented does not constitute financial, investment, trading, or other types of advice and is solely the writer’s opinion.
3 comments